Overview
In July, we entered a particularly volatile part of the year for equity investors. The S&P 500 managed to rise 1.22% while the Nasdaq Composite dropped .73% and the Russell 2000 (Small Cap Stocks) moved up a whopping 10.16%. In international markets, the EPAC BM Index of developed economies (ex-US) rose 3.28%. The MSCI EM (emerging markets) progressed marginally and was up .37%.
In and of itself, summer months are generally difficult for investors for a variety of reasons including reduced liquidity and profit-taking from large institutional investors. The chart below shows how the S&P 500 has historically performed since the turn of the century, on a seasonal basis:
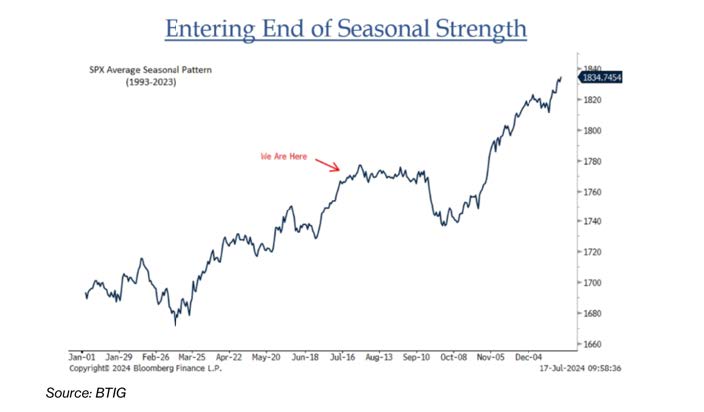
Basically, from July (red arrow) to mid-October, the index does not progress and sometimes drops sharply at the end of September. While there is nothing that dictates that things evolve every year similarly, remaining aware of these patterns should help the average investors endure the “dog days of summer”.
In July, US fixed income markets performances were positive as a continually slowing inflation rate made it more likely for the Federal Reserve (FED) to start cutting interest rates. The AGG index was up 2.34%, while Investment Grade and High Yield bonds rose respectively 2.38% and 1.94%. The Bloomberg municipal index was up .91%.
In July, our median portfolio gained 1.01%. Over the same period, a portfolio consisting of 50% ACWI (All Country World Index) and 50% AGG (US Bond Aggregate) rose 1.98%. YTD our median portfolio, net of fees, is up 7.07% vs 7.39% for our reference index.
Market developments
The economic picture in July became blurrier. The ISM survey (Institute of Supply Management) that measures the strength of manufacturing and service production in the USA dropped to a worryingly low level, as shown below:
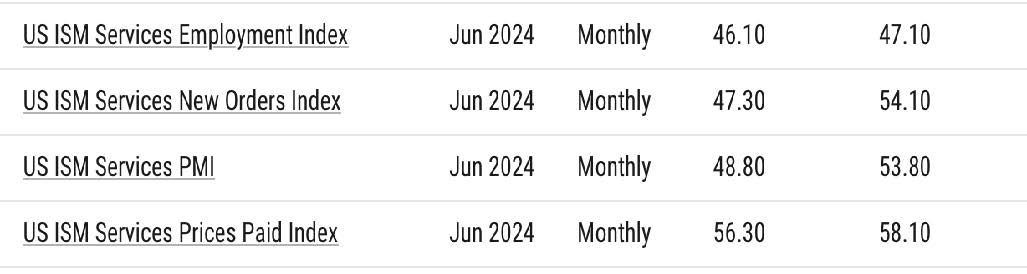
A reading below 50 is a sign of slowing economic activity and is associated with a higher risk of contraction. The slowdown indicated in the table above was broadbased. However, the ISM survey is a volatile economic indicator, and investors largely chose to ignore it after a brief negative market reaction to the news.
Meanwhile, another important economic marker, the unemployment rate, rose to 4.1%. However, hiring remained robust during the month of June, increasing by 206,000 as indicated below:
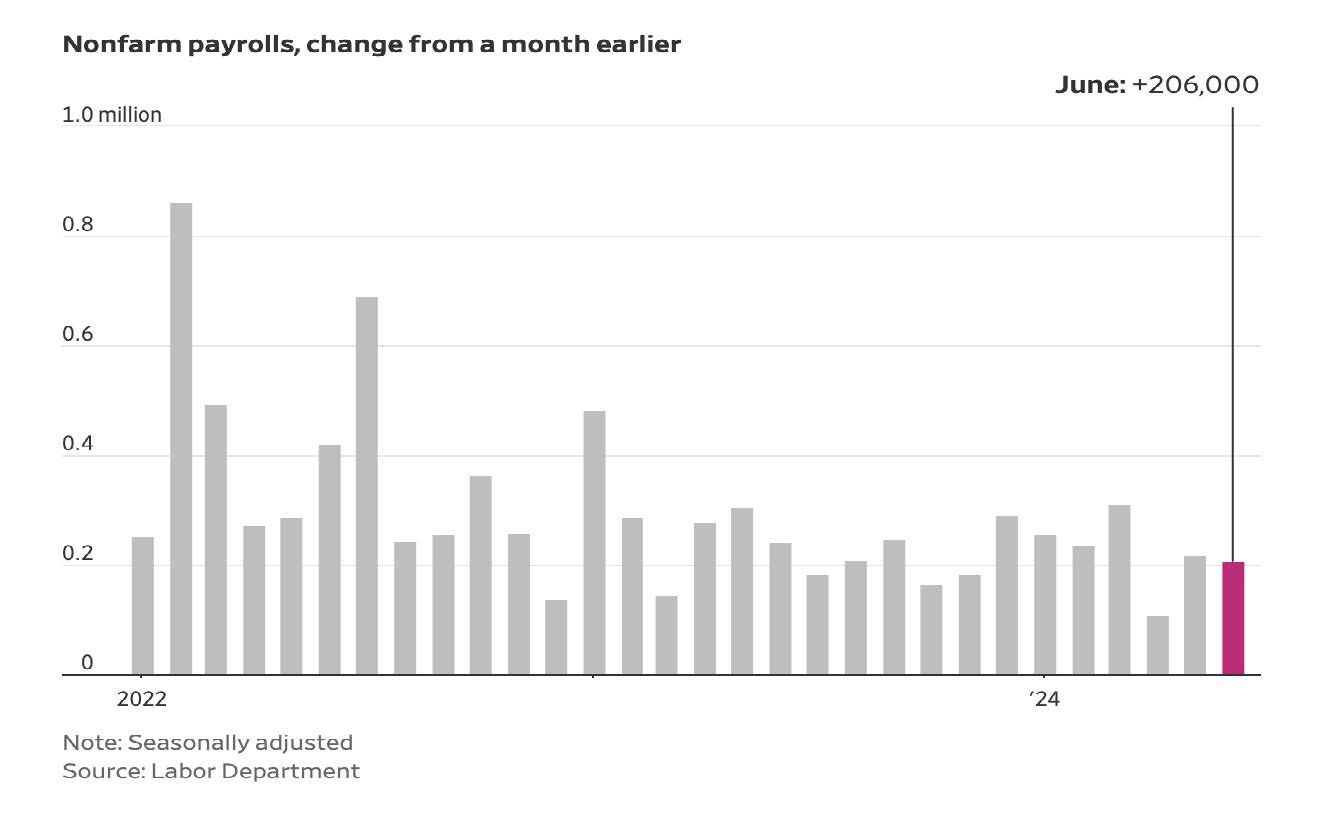
All in all, this was still a strong level of job creation and investors’ belief that the FED was managing to fight inflation without significantly slowing the economy remained dominant.
This somewhat mixed economic picture caused market volatility to increase though. And while we finished the month with positive equity performances, a significant sectorial rotation took place at the mid-point of the month. More on this in our next section.
Portfolio Commentary
In early July, I continued to reduce our exposure to equities due to persistent geopolitical tensions and increasing economic risks.
Specifically, I sold more of our IEFA (international developed market equities) investments. As of now, I have reduced our exposure to international equities by about 66% of our initial investment.
In addition, the valuation of large capitalization stocks in the tech sector continued to rise. It has now attained levels that can hardly be sustained should a weaker economic environment sets in. With that in mind, I felt that it was prudent to reduce our exposure to this sector. I did so by switching out of our investment in SPY (S&P 500 ETF) to invest in RSP. RSP is an ETF that weighs all the components of the S&P 500 on an equal basis rather than on a capitalization basis, which is the way the S&P 500 index is computed.
In other words, by switching from SPY to RSP, I made the components of the S&P 500 equal to one another rather than letting NVIDIA, for example, represent 7.5% of our investment. 7.5% is the current weight of NVIDIA in the S&Ps 500. It is therefore the weight it has in SPY. In RSP, its weight is 1/500%. The same applies to Apple, Amazon, Meta etc…
It seems that other investors have had the same idea, as indicated in the table below:
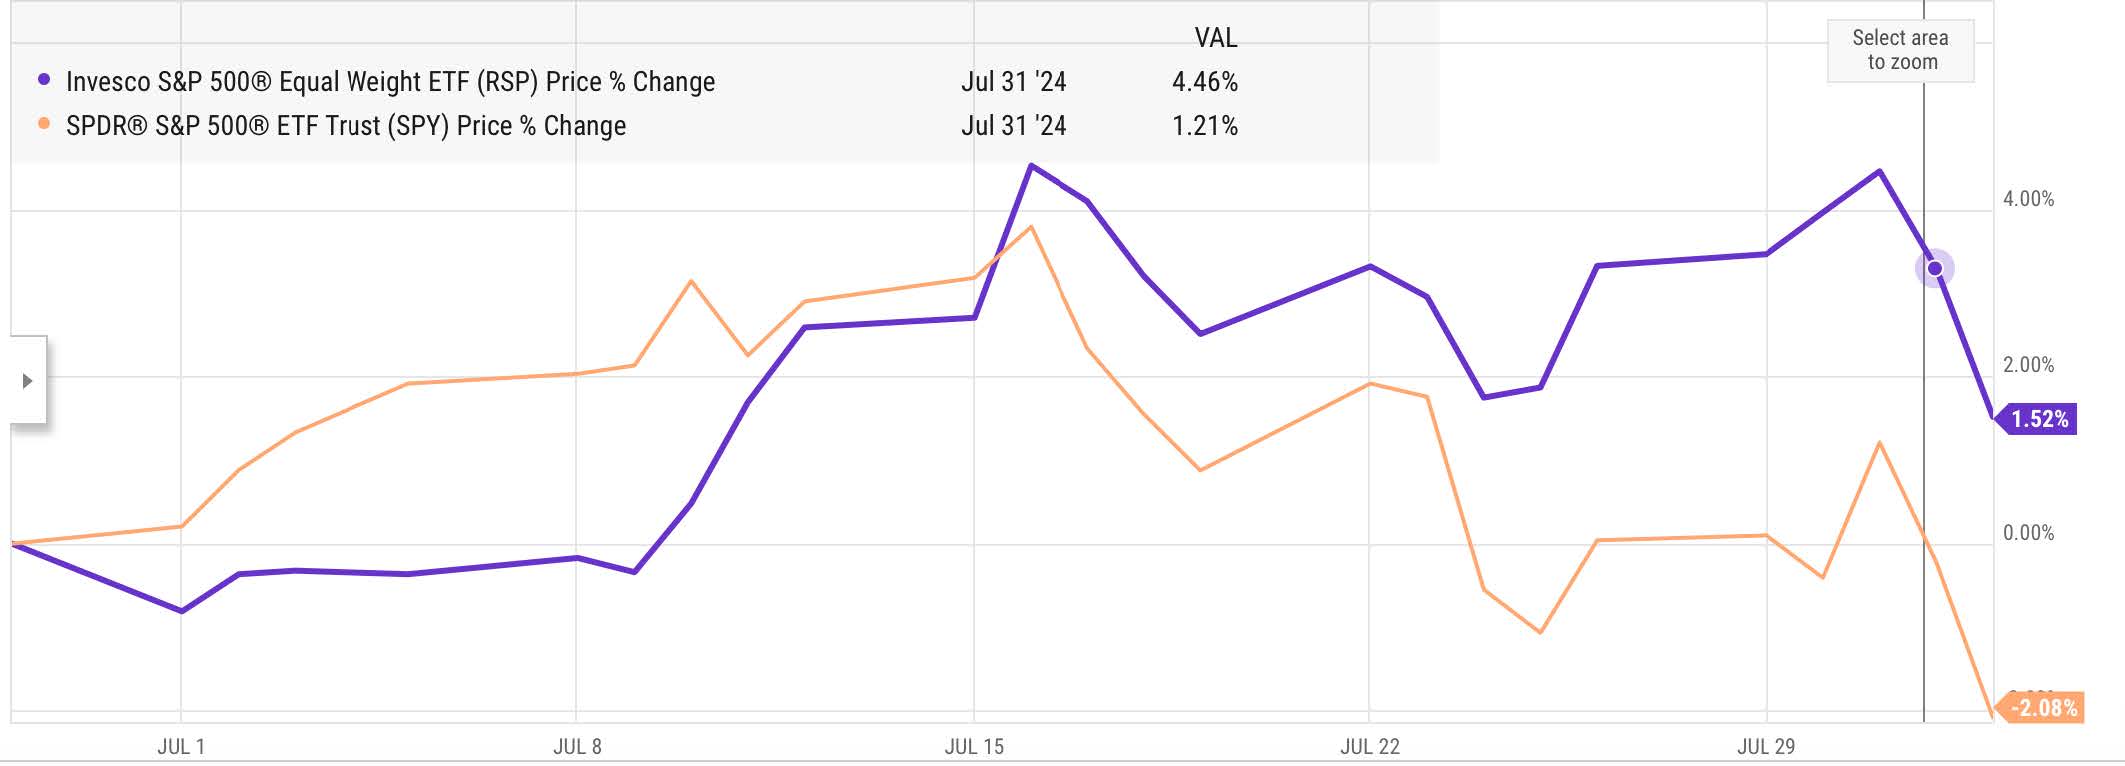
From the end of June through July 31 (vertical line on the graph) RSP had progressed 4.45% while SPY increased 1.21%. This is indicative of the sectorial rotation out of large capitalization stocks in the tech sector. This sectorial rotation has more to go, particularly if signs of economic slowdown are confirmed in the coming weeks and months.
Please, note that I made this switch from SPY to RSP using your qualified accounts (IRA, Roth accounts). I did not do so in your taxable accounts to avoid generating large capital gains. We have had investments in SPY for a while now and selling this position could generate, depending on the circumstances, capital gains ranging from 25% to 100%.
Conclusion
Markets have dropped significantly over the first two days of August, following additional signs of economic slowdown.
A metric of manufacturing activity published on August 1 confirmed that a contraction might be setting in. Additionally, the surprisingly low number of jobs generated in July, published the following day, increased market concerns. The unemployment rate rose to 4.3% as of the end of July compared to 4.1% at the end of June.
After two days in August, market sentiment has moved from “the FED has orchestrated a soft landing of the economy” to “the FED has tightened interest rates for too long and is now behind the curve”. In the first instance, we avoid a recession, in the second, we have one.
Whether this change of sentiment persists and causes further market selling will largely depend on incoming economic data.
For now, a volatile market environment is to be expected, compounded by seasonal factors and persistent political anxieties.
Thank you for your continued trust.
Jeff de Valdivia, CFA, CFP
Fleurus Investment Advisory, LLC
www.fleurus-ia.com
(203) 919-4980