Overview
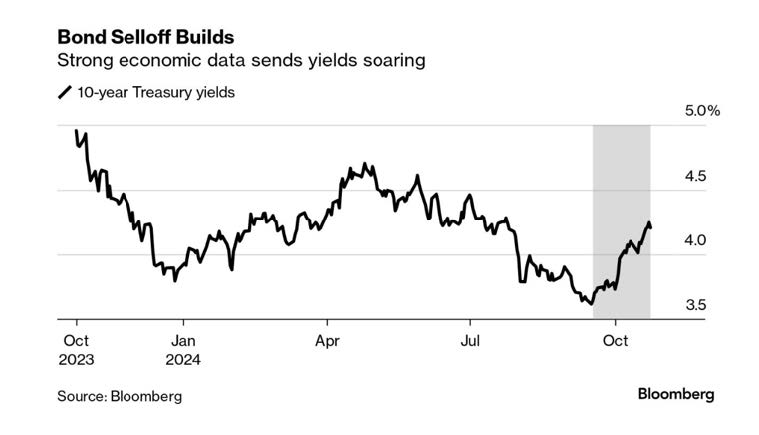
US equities drifted down in October due to robust economic data that tempered the perceived chances of the Federal Reserve Bank (FED) aggressively reducing interest rates. Internationally, the damage to equities was more sustained as the USD and US yields rose with the increasing odds of a Trump victory in the US presidential elections.
The S&P 500 dropped .95% overall while the Nasdaq composite inched down .49%. The Russell 2000 (Small Cap Stocks) appeared to be more sensitive to increasing economic and political volatility and went down 1.44% this past month.
In international markets, the EPAC BM Index of developed economies (ex-US) collapsed 5.30% while the MSCI EM (emerging markets) dropped 4.38%. A sharply rising USD, coupled with a sharp steepening of the US yield curve, contributed to the pathetic performance of non-US equity markets.
The graph below illustrates the sharply rising yield on the US Treasury 10-year note in October:

In October, US fixed income markets performances were down. The AGG index finished the month with a 2.48% loss, while Investment Grade and High Yield bonds declined respectively 2.43% and .54%. The Bloomberg municipal index was down 1.46%.
Our median portfolio was down 1.25% in October. Over the same period, a portfolio consisting of 50% ACWI (All Country World Index) and 50% AGG (US Bond Aggregate) dropped 2.31%. YTD our median portfolio, net of fees, is up 9.22% vs 8.95% for our reference index.
Market developments
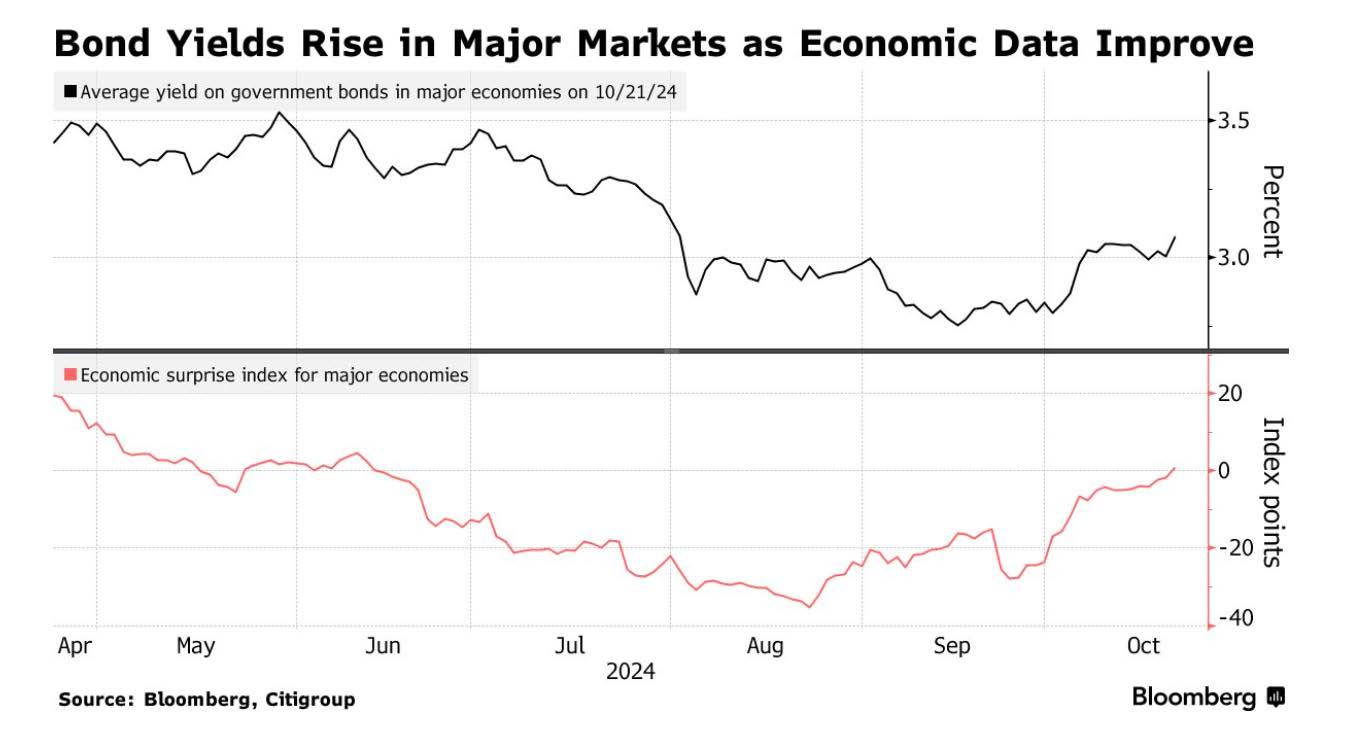
The month of November started in an environment dominated by rising international tensions and robust US economic data. The war in the Middle East continued unabated pushing the USD and oil prices up. Then came better than expected US employment data.
Both factors contributing to rising bond yields, in the US and internationally, as shown below:

Additional evidence of robust US economic data in the form of supportive retailing activity came in later in the month, pushing again US yields and the USD up further.
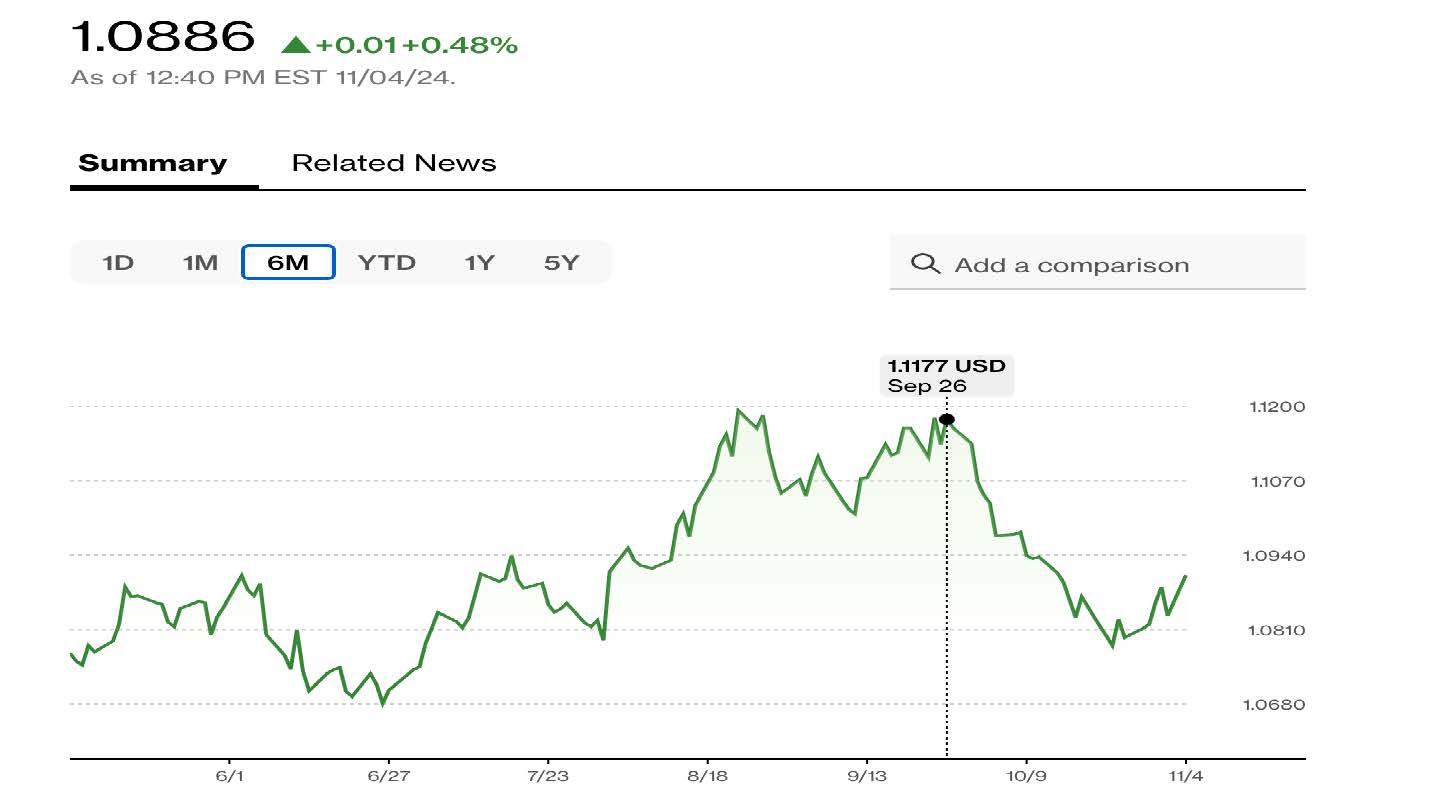
The chart below illustrates the tumble of the € versus the USD since the end of September.

It is interesting to note how negatively correlated the value of the € seems to be to the odds of a Trump victory in the upcoming US presidential election.
The € went down sharply in the first three weeks of October together with the rising odds of a Trump victory and then reversed over the past few days as those odds receded.
Portfolio Commentary
In early November, with continued tensions in the Middle East and increased market volatility associated with a corrosive US political climate, I sold all our remaining IEFA positions. IEFA is the ETF that gives us exposure to international developed equity markets.
I have been reducing our exposure to IEFA since mid-July as geopolitical tensions continued to grow. IEFA lost 6% in November. Our early selling shielded us from most of the damage.
Separately, better than expected third quarter earnings from SCHW (Schwab) pushed the value of this equity up 10% in November. After a poor performance for most of the year, I greeted the turn-around with a bit of relief. Both the selling of IEFA and the substantial increase in SCHW explain our relative outperformance in November.
Detracting from performance this month was Air Liquide. This equity suffered from both the loss of value of the € vs. the USD and from the deteriorating investment climate for non-US equities.
The chart below summarizes the bifurcated performance of both equities in October:

Finally, I have raised our cash positions to a relatively high level. It hovers around 5% for most portfolios. I feel that the current political and geopolitical uncertainties warrant this prudent approach.
Conclusion
Looking ahead, the results of the US elections will have significant economic implications.
A Trump victory is likely to push long-term interest rates up due to additional tariffs on imported goods and from their stag-flationary impact on the US economy.
A Harris victory, while less immediately taxing to the economy, would still add to the US budget deficit in the long run.
As a final note, below is a graph that shows how two organized betting exchanges see the odds of victory for each candidate, as of this morning (a “whale” in market parlance is a speculator who takes such a large position in a security or in a contract that he ends up moving the whole market for this security or that contract).

Thank you for your continued trust.
Jeff de Valdivia, CFA, CFP
Fleurus Investment Advisory, LLC
www.fleurus-ia.com
(203) 919-4980
