Overview
In the early days of August, a softening US unemployment picture and the quasi-simultaneous unraveling of carry trades out of Japan caused equity markets to lose about 6% in the US before regaining their footing to finish the month in positive territory.
The S&P 500 managed to rise 2.43% overall while the Nasdaq Composite gained a lesser .74% and the Russell 2000 (Small Cap Stocks) declined 1.49%. In international markets, the EPAC BM Index of developed economies (ex-US) rose 2.57%, supported by a receding USD. The MSCI EM (emerging markets) progressed 1.40%.
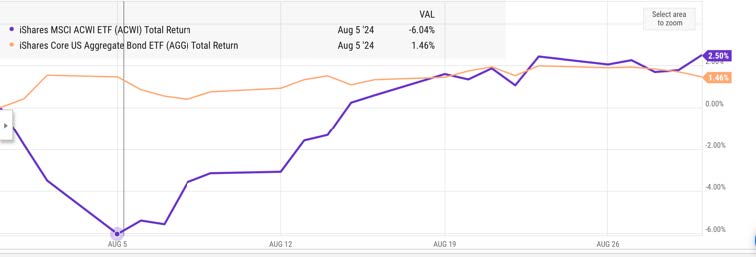
The graph below illustrates the initial equity decline and subsequent recovery (purple line) and contrasts it with the relatively benign behavior of the bond market during the same period (orange line).

In August, US fixed income markets performances were positive. in the first days of the month, the fear of an equity meltdown caused investors to “seek shelter” and buy US bills and bonds. The AGG index rose (orange line above). As the month progressed, supportive inflation data reinforced the positive momentum for US bonds. The AGG index finished the month up 1.44%, while Investment Grade and High Yield bonds rose respectively 1.57% and 1.63%. The Bloomberg municipal index was up .79%.
In August, our median portfolio gained 1.68%. Over the same period, a portfolio consisting of 50% ACWI (All Country World Index) and 50% AGG (US Bond Aggregate) rose 1.98%. YTD our median portfolio, net of fees, is up 9.09% vs 9.55% for our reference index.
Market developments
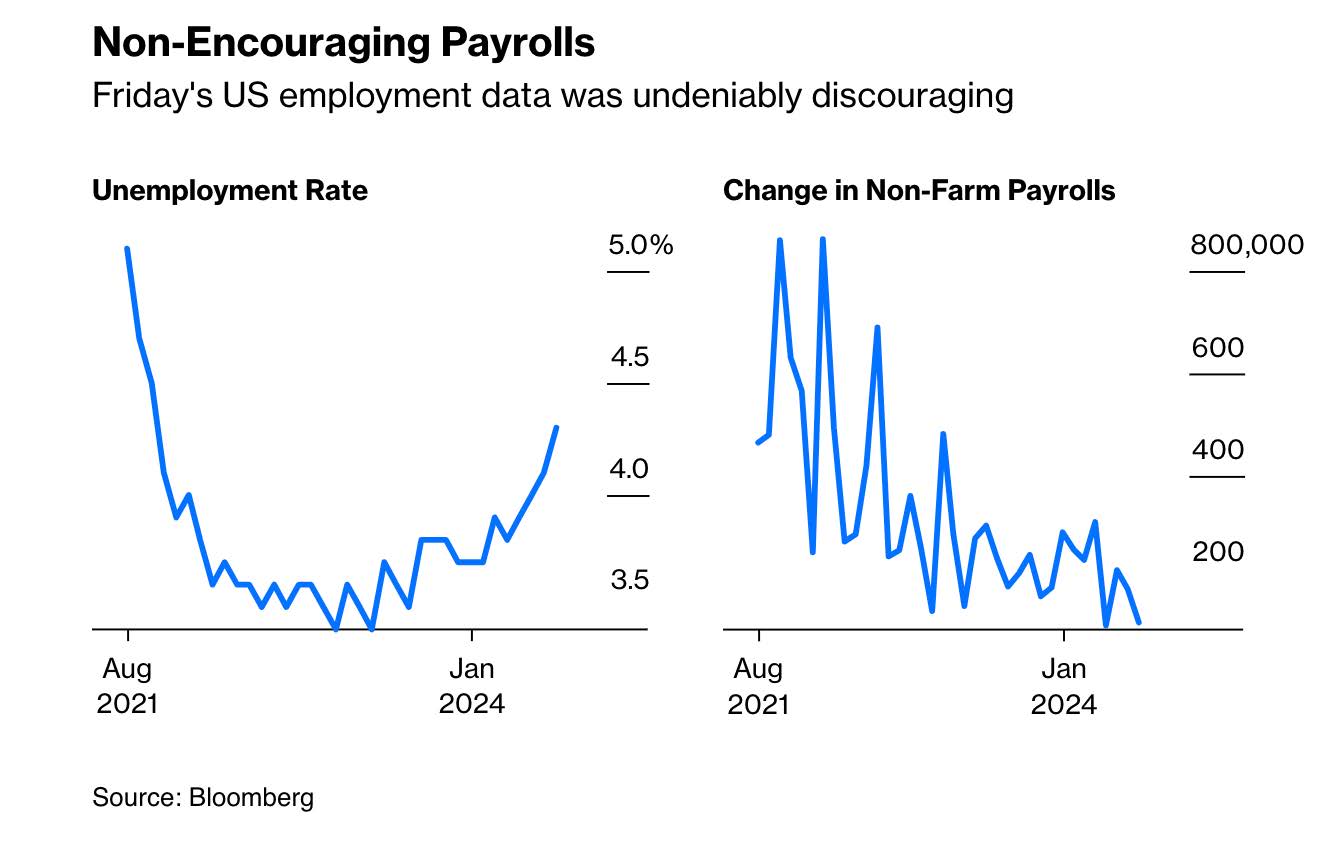
What had been a negative end of July for equities, with a (partial) rotation out of the technology sector, accelerated in the early days of August with poor unemployment numbers published on the 2nd of the month. The prospect of a US economy weakening at a faster clip than expected caused equities to swoon around the world. Was the FED behind the curve? Had it waited too long to cut interest rates? Such were investors’ concerns.
All of this came about as a result of the information contained in the graph below:

To fears of a sharp US slowdown (illustrated above) were added technical factors.
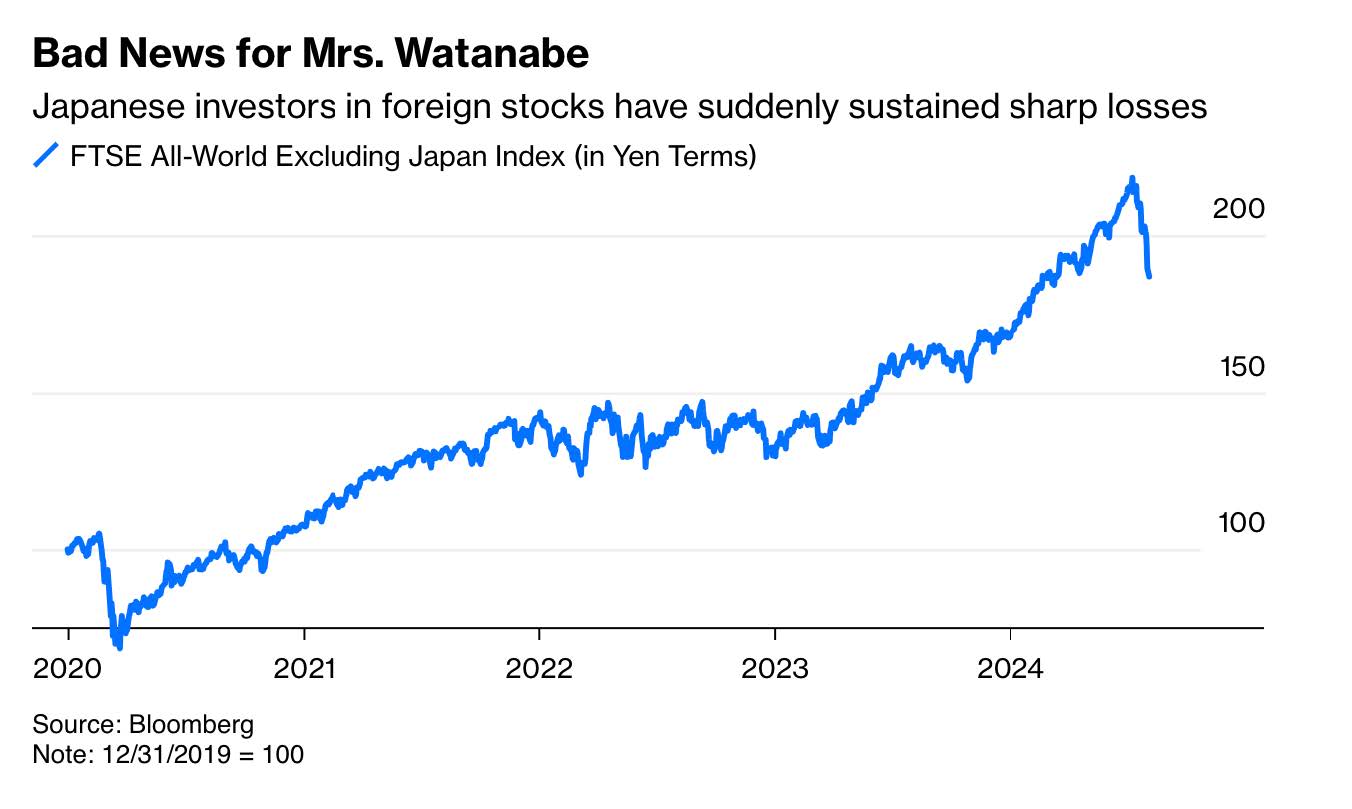
At almost the same time as weak unemployment numbers were published, international speculators started unwinding carry trades, causing the Yen to rise and US equities to take a further tumble. The graph below illustrates, in part, the nasty turn of events between mid-July and the beginning of August for investors whose base currency was the Yen (sharp drop at the right of the graph).

Without getting into too many details, one of the winning trades for international investors over the past few years has been to borrow Yen at almost 0 % and plow the proceeds in US equities.
This type of investing tactic works as long as the Yen does not rise and/or US stocks do not wobble too much.
However, starting in mid-July, with a rising Yen the consequence of a more robust monetary policy stance from the Bank of Japan and with the publication of weak unemployment numbers in the US in early August, the carry trade unraveled, causing US equities to further drop as speculators had to pay back their Yen-denominated loans by selling their US stock holdings.
Fortunately, this unwinding did not last. Reassuring inflation data and supportive retail sales numbers, published a few days later, convinced investors that the US economy was still sturdy enough and that the FED would soon lower interest rates. Markets have since stabilized.
Portfolio Commentary
In August, I continued to add to our investment in RSP, an ETF that tracks the equally weighted version of the S&P’s 500. My thinking is that if the FED successfully engineers the soft landing of the US economy, equities should further gain and do so beyond the technology sector. We should capture this trend with our RSP investment. So far, this has been a successful move, as illustrated below:

RSP is up 1.94% since mid-July, when we initiated this arbitrage. Over the same period, SPY (the ETF that tracks the S&P’s 500, as a market capitalization index) declined .26%.
Elsewhere in our portfolios, I redeployed the cash from maturing US Treasury bills, into AGG. This ETF has a duration of about six years (duration is a measure of an investment’s sensitivity to interest rate movements). As such, it should benefit relatively more than short-term treasuries from the gradual decline of US interest rates over the coming months.
A last word concerning Charles Schwab. Their stock has been the main reason why the median portfolio under Fleurus’ management is slightly underperforming our benchmark this year.
As interest rates continue to drop, bank and brokerage stocks should find a more supportive environment and attract more interest from investors. I am confident that we should see a nice turnaround in SCHW before the year is over.
Conclusion
September is traditionally a difficult month for equities.
I have never heard a particularly convincing reason why this is, but it seems to happen 80% to 90% of the time. With due respect for statistics and seasonality, prudence is therefore warranted.
Looking ahead, we have a very likely softening of monetary policy to be announced on September 11 with the FED reducing its intervention rate by an anticipated .25%. That is, unless the unemployment number to be published this coming Friday is particularly disappointing. If that were the case, a reduction of .50% might be possible. The consequences of either move are hard to predict.
Finally, Capital Economics, the economic service I subscribe to projects equity gains of close to 10% between now and the end of the year. They are staffed with competent economists and market specialists. I pay attention to their predictions and analysis. However, I am not fully convinced and would be happy with a gain of half of that magnitude.
Thank you for your continued trust.
Jeff de Valdivia, CFA, CFP
Fleurus Investment Advisory, LLC
www.fleurus-ia.com
(203) 919-4980
